

Early in the college football betting season, there are a lot of unknowns. Roster turnover, coaching changes, and uneven game schedules cloud objective team evaluation and muddy the waters for capping Week 1 action.
So, each season, I review each of the previous week’s games to try to identify systematic trends that may offer a predictive edge betting the early-season non-conference. After examining Week 1 action, I identified one metric with a strong correlation (r=0.62) to game outcome: Success Rate.
Let’s take a look at what it is and how it should affect our Week 2 bets.
Success Rate Predicts Early-Season Success
What Is Success Rate?
Success Rate is a metric that reports a team’s ability to gain or exceed expected yardage given down and distance. It may also be used to measure a defense’s ability to prevent the opposing offense from gaining expected yardage given down and distance.
Editor’s Note: Our NFL player prop packages are now available in weekly & monthly options. Or buy the full season and save 30% — packages starting at just $59.95 for the full season.
So, for example, a team with a high Offensive Success Rate often faces fewer third downs (due to their efficiency on first and second down) and also likely faces more manageable yards to gain on those third down plays. Conversely, a team with a high Defensive Success Rate is adept at stuffing first and second down plays, thereby forcing the opposing offense into frequent third-and-long scenarios and other inefficiency game script conditions.
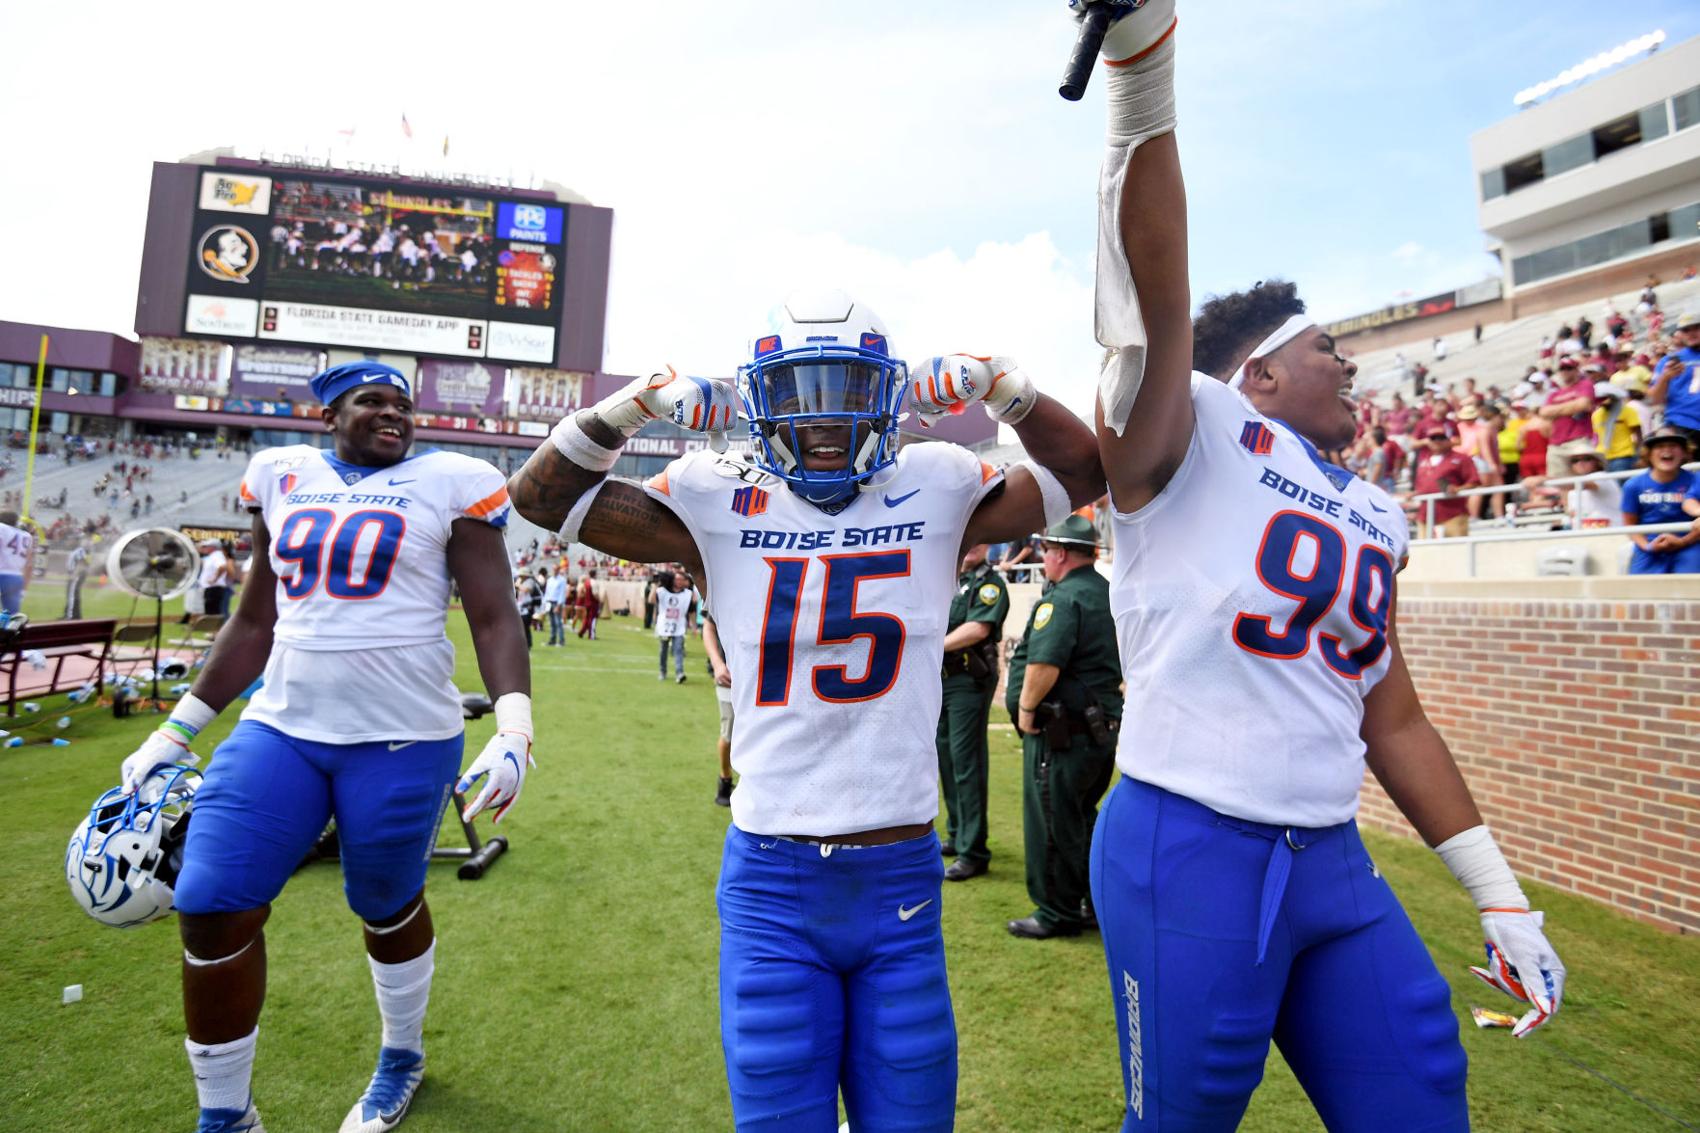
Week 1 Example: Boise State vs. Florida State
With that abstract explanation out of the way, let’s use a Week 1 example to highlight how a team’s Success Rate affects game outcomes.
Boise State and Florida State faced off in Tallahassee on Saturday, and the Broncos managed to squeak out a 36-31 win (and, more importantly, they covered the +6.5 spread). But, if you followed along with that game, you know that the final score barely scratches the surface of how that game truly played out.
The Seminoles jumped out to a 24-6 early lead due in large part to a string of explosive plays. But, gradually over the second and third quarters, Boise State crawled back into it — simply by sticking to the script, running their offense, and forcing Florida State to make another play. The Seminoles failed to answer that challenge when put to the test, and Florida State fans had to sit in suspended agony as they watched Boise State mount a 30-7 comeback to win.
How precisely did Boise State accomplish this comeback? It wasn’t turnovers (Florida State held a 3-2 edge for the game), and it wasn’t penalty yardage. Instead, the Broncos persistently forced Florida State into third down after third down, and the Seminoles buckled. Meanwhile, the Boise State offense chugged along, systematically converting over and over again for about 40 minutes.
By game’s end, Florida State had only converted one of 12 third downs. The Broncos went 10-of-19. This is how Success Rate affects game outcomes.

This Outcome Should Have Been Expected
Entering the game, Boise State boasted a 34th-ranked Defensive Success Rate in 2018. Florida State’s offense ranked 121st out of 130 FBS schools in Offensive Success Rate last season. That 87-rank differential between the two teams showed up in the box score — and in the game’s outcome.
Altogether, Week 1 teams with a 2018 Offensive Success Rate at least 20 ranks higher than their opponent’s 2018 Defensive Success Rate went 21-12-1 (63.6%) ATS. Similarly, teams with a 2018 Defensive Success Rate at least 20 ranks higher than their opponent’s 2018 Offensive Success Rate went 17-10-1 (63.0%) ATS.
Make note of these early-season trends, and leverage Success Rate as a key measure for Week 2 betting action.
Teams That Fit Our Success Rate Trends for Week 2
The following teams fit one or both of our trends for 2018 Offensive Success Rate and Defensive Success Rate differential (at least 20 ranks) against their Week 2 opponents. The teams that fit favorably will be listed first for each Week 2 matchup and have their current consensus spread indicated in parentheses.
As with all betting trends, it is not advisable to bet blindly based solely on historical outcomes. Instead, use the following list of Week 2 matchups as a starting point for your betting research this week.
- Alabama (-54) vs. New Mexico State
- Texas Tech (-34) vs. UTEP
- Wisconsin (-33.5) vs. Central Michigan
- Virginia Tech (-29) vs. Old Dominion
- Penn State (-27.5) vs. Buffalo
- Kansas State (-24) vs. Bowling Green
- Michigan (-23) vs. Army
- Utah (-23) vs. Northern Illinois
- Appalachian State (-21.5) vs. Charlotte
- Iowa (-20.5) vs. Rutgers
- Wake Forest (-18.5) vs. Rice
- Ohio State (-16.5) vs. Cincinnati
- Mississippi State (-16.5) vs. Southern Miss
- Kentucky (-14) vs. Eastern Michigan
- Central Florida (-10) vs. Florida Atlantic
- UAB (-8.5) vs. Akron
- Ole Miss (-7) vs. Arkansas
- Tulsa (-7) vs. San Jose State
- LSU (-4.5) vs. Texas
- Nebraska (-4) vs. Colorado
- Syracuse (-2.5) vs. Maryland
- Arkansas State (+2.5) vs. UNLV
- Fresno State (+3) vs. Minnesota
- North Texas (+4) vs. SMU
- San Diego State (+7) vs. UCLA
- Western Kentucky (+9) vs. Florida International
- Coastal Carolina (+9.5) vs. Kansas