A couple weeks ago, I wrote an article explaining how we can leverage Success Rate to identify early-season against-the-spread (ATS) value in college football. Teams’ previous-season Success Rate metrics are relatively sticky year-over-year but are especially reliable during early-season action.
But Success Rate is not the only metric that offers this kind of year-over-year return. Indeed, there is another key metric upon which I lean heavily each college football season: Defensive Havoc.
I’m going to guide you through Havoc, what it is and how to take advantage of it, before laying out how I’m using it to identify my best CFB Week 5 bets.
Harnessing Defensive Havoc
What is Havoc?
Havoc is a metric that describes a team’s ability to disrupt offensive game plans through pass-rushing, tackles for loss, pass deflections, and forcing turnovers. These defensive qualities are what separate solid, disciplined defenses from elite, game-wrecking ones. To illustrate Havoc’s effect on game outcome, let’s take a look at a textbook example from Week 1.
Week 1 Example: Nevada vs. Purdue
Nevada hosted Purdue to kick off their 2019 season, but the Wolf Pack struggled early. They punted in each of their first four offensive drives and gained a total of 43 yards on 17 plays. The Boilermakers took advantage of Nevada’s slow start, jumping out to a commanding 24-7 lead by halftime.
But in the second half, the Wolf Pack defense wreaked Havoc. Nevada forced two interceptions, five fumbles (recovering three of them), seven tackles for loss, and five pass deflections. Those turnovers and general defensive mayhem kick-started the offense, and Nevada mounted its comeback. The Wolf Pack tied the game with less than a minute to play, then intercepted Purdue QB Elijah Sindelar to set up a game-winning field goal as time expired.
Purdue out-gained Nevada 519-to-404 in total yardage; but in the end, it was the Wolf Pack’s plus-five turnover differential that sealed their victory. More importantly (for our purposes), Nevada also covered their +11 spread by 14 points.
Editor’s Note: Our NFL props are hitting at 66% on the season. Join us now for just pennies per pick!
Havoc is Sticky From Year to Year
Havoc is one of the few advanced metrics that reports a statistically significant year-over-year correlation (r=0.48). The others are S&P+ and Success Rate, which I covered previously this season.
This year-over-year correlation indicates that if a team reports a high Havoc metric in one year, it is likely to produce another high-Havoc performance the subsequent year. Intuitively, we imagine that turnovers or QB hurries are largely random events in the course of a college football game. Sure, some teams may be more adept at creating Havoc than others, but it can’t be that consistent — can it?
Indeed it can — and it is. Despite coaching changes, roster turnover, player injuries, and unbalanced matchups, Havoc remains consistent from season to season. Why? In short, it’s because Havoc is as much about coaching philosophy as it is personnel.
Havoc is a defensive mindset — one which demands aggressive play-calling and concerted coaching effort. Some teams (like BYU, for example) forego the pursuit of Havoc in order to focus on Success Rate. Others, however, sell out the defense in order to induce mayhem — and those squads can be incredibly profitable ATS.
Historical Havoc Trends
In order to quantify the magnitude of Havoc’s effect on college football game outcomes, I dug through my personal archive of college football spreadsheets and ran a couple of trends for you.
I gathered team Havoc metrics from the past 14 seasons and put those metrics to the test against a couple of key game scenarios. I also established historical baselines for what defines a “high” Havoc team versus an average one.
“High” Havoc teams report a Havoc-rate of 19.0% or higher, which reflects a one standard deviation improvement relative to the 14-year mean Havoc rating for all teams. For reference, that mean Havoc rating is 16.2%.
For each of the forthcoming betting trends, I sorted high- and low-Havoc teams into two cohorts. Then, I recorded ATS win-loss records and win-rates for each group based on their performance in the following season. This second qualifier is important, and it is worth a small tangent in order to emphasize it:
Avoiding Hindsight Bias
Hindsight bias is a common error made by many surface-level analysts. In essence, hindsight bias occurs when an individual reviews data after the conclusion of a sporting event and then invokes that data as the logical precursor (or cause) that explains the given outcome.
For example, let’s say I want to report historical trends for Havoc (which I intend to do very soon). It would be foolish of me to use 2018 end-of-season Havoc metrics in order to evaluate 2018 week-to-week outcomes. When the 2018 season began, we had no foreknowledge of team’s eventual end-of-year Havoc ratings; indeed, all we had were team metrics from the end of the 2017 season.
Thankfully for us, Havoc is sticky from season to season. So, leaning on 2017 ratings to sort teams into cohorts is a viable method for predicting 2018 outcomes. This I did for each college football season in my analysis.
Now, on to the trends!
Trend No. 1: Havoc Provides an Edge in Tight Contests
- Condition: Game spread is within seven points, either positively or negatively. Team may be the Favorite or the Dog in said contest.
- Exclusion: Matchups between two teams in the same cohort (e.g. A “high” Havoc team versus another “high” Havoc team) are excluded from analysis. These are “duplicate” scenarios that do not accurately reflect a high Havoc team’s edge over non-high Havoc teams.
Results
| High-Havoc Teams | Average-Havoc Teams | |||
|---|---|---|---|---|
| Range | ATS Record | Cover-Rate | ATS Record | Cover-Rate |
| 2006 to 2019 | 576-498-30 | 53.6% | 930-914-44 | 50.4% |
| 2014 to 2019 | 188-156-11 | 54.7% | 395-362-21 | 52.2% |
| 2016 to 2019 | 123-98-8 | 55.7% | 221-226-14 | 49.4% |
In addition to reporting cumulative 14-year ATS records and cover-rates, I’ve also provided five-year (2014 to 2019) and three-year (2016 to 2019) records. Often in modeling and forecasting, it is helpful to utilize three- and five-year trailing averages in order to stabilize a robust longitudinal analysis.
Our full 14-year ATS results give us a strong baseline expectation for our trend. The three- and five-year results provide a glimpse into our trend’s recent general trajectory.
In this case, our trend is bullish on high-Havoc teams. The all-time cover-rate for high-Havoc teams in tight-spread contests is 53.6% — which is enough to break even on your investment, but not much to write home about. However, since 2014, that cover-rate has improved to 54.7%; and since 2016, it has improved yet again to 55.7%.
This indicates that high-Havoc teams boast an ATS edge in tight game scripts. When two teams are evaluated within a single touchdown of one another, Havoc tends to decide game outcomes.
Trend No. 2: Havoc Improves Win Probability for Small Underdogs
- Condition: Game spread is between +0.5 and +7, and the team of interest is the Dog.
- Exclusion: Matchups between two teams in the same cohort (e.g. A “high” Havoc underdog versus another “high” Havoc team that is favored) are excluded from analysis.
Results
| High-Havoc Teams | Average-Havoc Teams | |||
|---|---|---|---|---|
| Range | ATS Record | Cover-Rate | ATS Record | Cover-Rate |
| 2006 to 2019 | 317-239-20 | 57.0% | 964-920-50 | 51.2% |
| 2014 to 2019 | 117-82-7 | 58.8% | 417-390-22 | 51.7% |
| 2016 to 2019 | 64-41-5 | 61.0% | 181-177-15 | 50.6% |
After our initial trend reported promising results, I then focused my attention on underdogs. Our first trend reported ATS results for all high-Havoc teams in tight-spread games; this second trend focuses solely on underdogs in these contests.
Dogs report an impressive 57.0% 14-year cover-rate with a very healthy sample size to support that trend. Moreover — much like we saw with our first trend — that cover-rate has steadily improved recently. Over the last five years, it has swelled to 58.8%; over the last three years, high-Havoc teams report a staggering cover-rate of 61.0% ATS.
If you blindly wagered a single unit on all teams that fit this trend since 2016, you’d be up 16.6 units over that span for a 58.2% return on investment (ROI).
Teams That Fit Our Havoc Trend for Week 5
Three teams fit our criteria as high-Havoc teams last season playing as underdogs in Week 5: Kentucky, Mississippi State, and Virginia.
Kentucky (+3) at South Carolina
Among those three, only Kentucky fits our trend as a small underdog against South Carolina. The Gamecocks are three-point home favorites. Nonetheless, while the Wildcats may fit our trend, their defense does not pass the eye test to reinforce our potential betting position. Kentucky lost All-American LB Josh Allen to the NFL draft this offseason, along with major departures (and injuries) in their secondary.
The Wildcats have given up 400-plus yards in consecutive games against Florida and Mississippi State, and their early-season statistics do not hint at continued high-Havoc potential this season. As a result, I’m electing not to place action on Kentucky despite their fit within our historical trend analysis.
But not to worry — I’ve still got two plays on tap this week for Mississippi State and Virginia. Both teams are more than seven-point underdogs, but their 2019 early-season performance more strongly supports their status as high Havoc teams. So, I’m making a small exception for them and betting their sides despite the wider spread.
Mississippi State (+10.5) at Auburn
Mississippi State draws a difficult SEC matchup on the road against Auburn. But, there is plenty of cause for optimism. The Bulldogs’ early-season defensive performance has affirmed their sixth-ranked Havoc rating (20.3%) from 2018.
Through four games, the Bulldogs lead the country with seven forced fumbles and are tied for the NCAA lead in total turnovers forced (11). Mississippi State has also taken care of the football on offense, resulting in a seventh-ranked turnover margin (+4). On top of that, the Bulldogs defense has been stingy when it counts: On third-down. Opponents report an abysmal 24.4% third-down conversion rate against Mississippi State this season, which ranks 123rd out of 130 FBS teams.
Virginia (+12.5) at Notre Dame
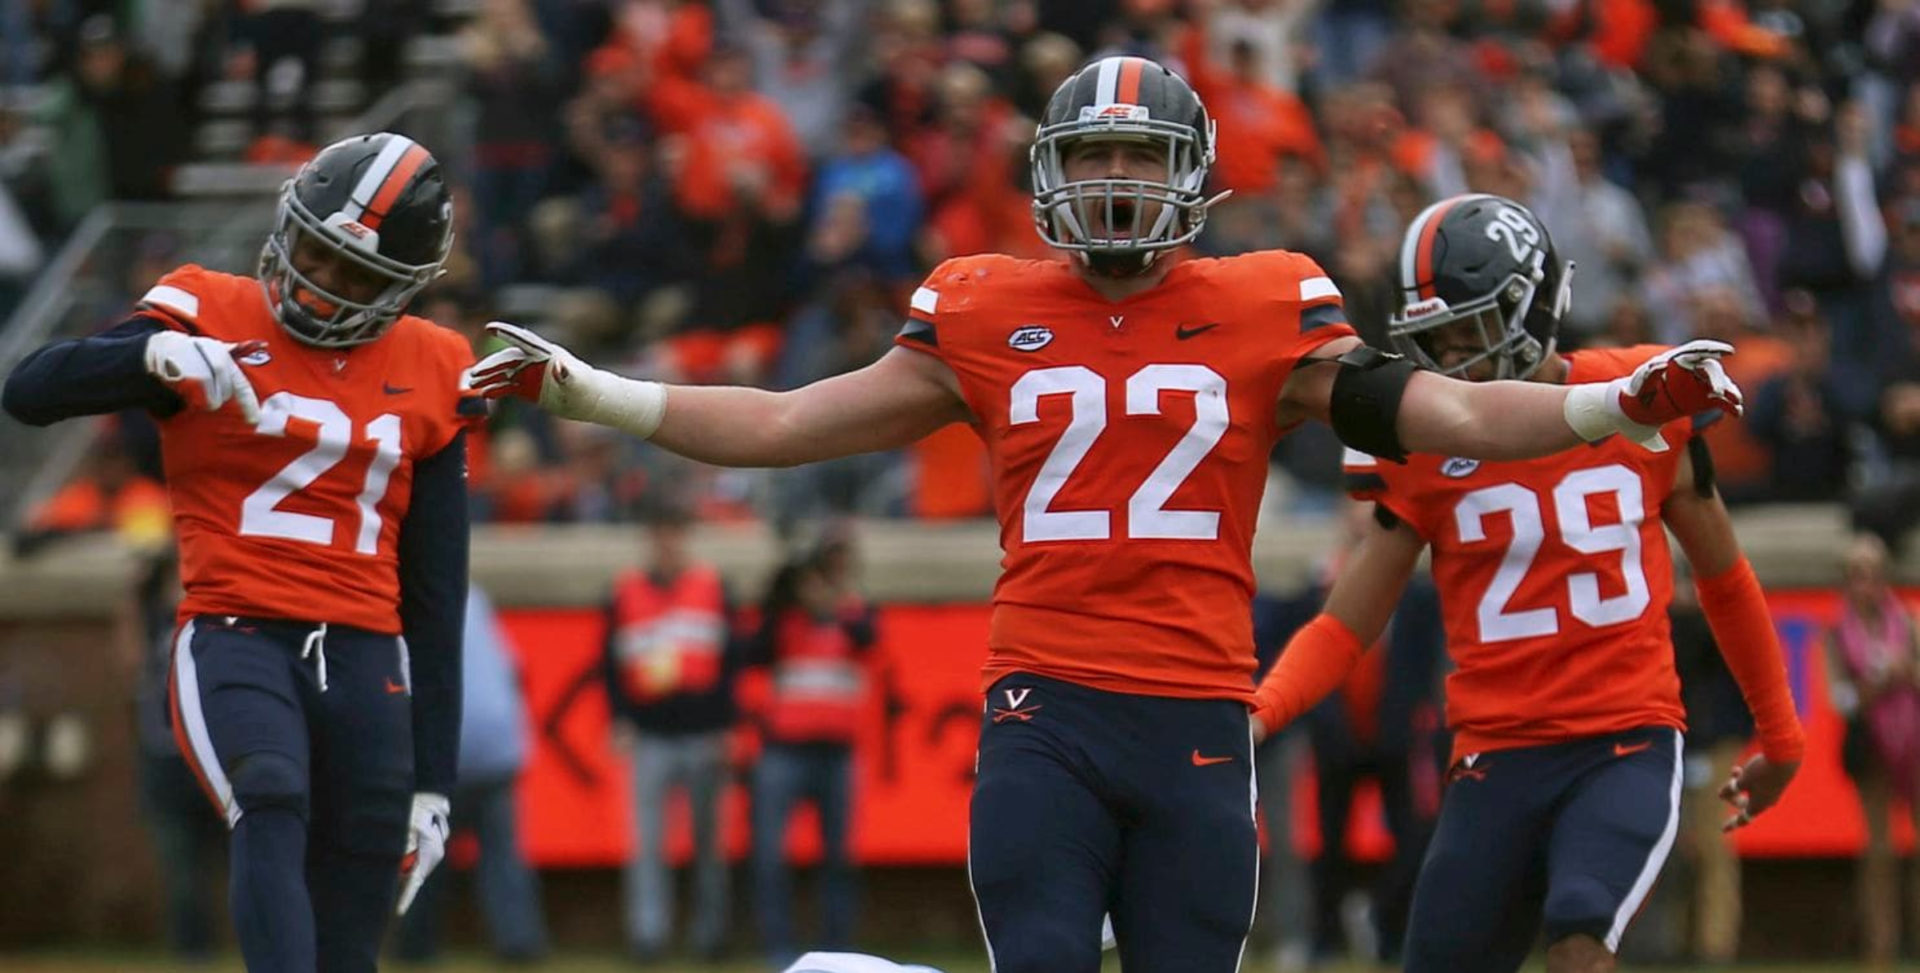
I like the Bulldogs this week, but I love the 18th-ranked Cavaliers against No. 10 Notre Dame. Virginia may not boast an elite cast of highly-recruited play-makers, but the Cavaliers have far outperformed their skill level through four games. Just take a look at Virginia’s Havoc-like profile through four games:
- First in the nation in sacks (20)
- Third in tackles for loss (39)
- 12th in rush defense (75.0 yards per game)
- 14th in total defense (263.8 yards per game)
- 29th in scoring defense (18.0 points per game)
- One of only nine teams with two defensive TDs — both via interception returns
- One blocked punt and one kick return TD
QB hurries, sacks, rush penetration, a ball-hawking secondary, defensive scoring potential, special teams acumen — it’s all there. This is what Havoc looks like, and that’s why I’m taking Virginia to cover the +12.5 against the Fighting Irish in South Bend.


