

- We’ll examine the effect that a team’s implied win probability (i.e. Money Line odds) has on NFL player props — do projected game scripts affect prop results as much as we think?
- This data comes courtesy of the player prop database at playerprops.football and is composed of all closing lines from Bovada going back to 2017
- This is the second of a four-part series, as we now look at this on wide receivers
- Our NFL Early Bird props Packages are available for a limited time — Save 20% on a full season with 100% refund guarantee if the season is canceled at any point
Earlier, we asked what impact projected game script has on NFL props for RBs and came to a surprising – counterintuitive, even – conclusion: it works pretty much the opposite of how you’d expect.
RBs don’t go over their rushing totals more frequently as big favorites, nor do those playing as big underdogs go over their receiving total more often. Of course, as we know by now, it’s almost always +EV to bet the under, but there are some more nuanced conclusions we found too, so be sure to check out Part 1.
Today, we’ll cover WRs in Part 2 of what will eventually be a four-part series. Will our conclusions here align with what we found in the RB article, or does game script work in a more intuitive way for WRs? Let’s take a look.
Editor’s note: Keep in mind that while this data is a helpful guide, it is not perfect nor complete — it’s one snapshot in time from one specific betting market and results will vary across different books.
Game Script Matters but Not How You Think (Again)
How do WRs perform relative to their Over/Under total on different prop bet types when their team is favored?
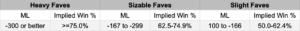
Because it doesn’t seem fair to put all favored teams in the same bucket, I separated them into three groups:
- Heavy Favorites (>=75.0% implied win probability or at least -300 on the Money Line)
- Sizable Favorites (62.5%-74.9% implied win probability or between -167 and -299 on the Money Line)
- Slight Favorites (50.0-62.4% implied win probability or +100 to -166 on the Money Line)
You can also use this reference table below to see the definition of each group.
First, let’s see the data for WRs whose team was favored.
![]()
Next, WRs playing for the underdog.
![]()
How to Read the Table
We’ll use receiving yards as an example.
We know teams throw more when they are down big, so you’d think that WRs on those teams would go over their yardage total more often. But as with RBs, that’s not always the case.
WRs on heavy underdogs go under their yards line 57.9% of the time, whereas heavily favored WRs go under 55.1% of the time.
Once again, it appears that linemakers and the general betting public are aware of the impact of game script and perhaps overcorrect for it.

Takeaways
- Continue to target unders regardless of game script.
- For receiving yards, it looks like it might slightly better to bet the under when a WR is an underdog. We saw something similar with RBs to a slightly greater degree.
Editor’s Note: Our working theory on this effect is as follows: bad teams are bad. Hard-hitting analysis, I know, but it makes sense — they sustain fewer drives and are less competitive, thus they go Under more often, regardless of implied game script.
- If you are looking for overs, you could do worse than targeting Receptions on WRs who are playing as “Heavy Dogs” category, but it’s such a massive difference from the other groups that you have to take it with a healthy dose of skepticism, as we’ll talk about in the next bullet point.
- Once again, it’s important to zoom out instead of focusing too heavily on any one bucket. For example, WRs go under their receptions total 55.2% of the time when their team is a sizable underdog but only 50.2% of the time as heavy underdogs. Considering those groups are right next to each other, the true difference likely isn’t as large as those numbers would make it seem.
- The “Heavy Dogs” buckets are smaller than the others simply because not many teams were +300 or worse. Still, both of them had at least 200 bets, and sample sizes are much larger overall than what we had in the RBs article.
Overall, game script isn’t as impactful on WRs as it is for RBs, with the gaps between the buckets being generally smaller. Part of the reason for that is the larger WR sample sizes make it a more efficient market than RBs, the latter of which can be quite inefficient, as we found out last year.
How to Play It
Unders remain the play, but it’s important to recognize that you aren’t getting the edge from game script you think you are because everyone involved (linemakers, other bettors, etc.) is aware that teams run more when they’re ahead and throw more when trailing.
A lot of analysis in this space centers around game script, and it’s important to realize that most people’s ideas surrounding game script are not borne out by data.
And of course, a lot of this is going to depend on how props are being priced, which is a study for another day.
Thanks for reading Part 2 of this four-part series. Over the next few days, we’ll take a look at how projected game script affects quarterbacks and tight ends.