

- We’ll examine the effect that a team’s implied win probability (i.e. Money Line odds) has on NFL player props — do projected game scripts affect prop results as much as we think?
- This data comes courtesy of the player prop database at playerprops.football and is composed of all closing lines from Bovada going back to 2017
- This is the third of a four-part series, as we now look at this effect at quarterback; you can find the research for RBs here and WRs here
The conclusions from those two pieces have been surprising, so you’ll want to go ahead and check those out before we move on to QBs. Intuitively, it would make sense that they attempt and complete more passes and possibly throw for more yards when their team is expected to lose.
On the converse, teams that are expected to win might employ a more run-heavy approach in an effort to drain the clock, and their QB’s volume numbers would suffer as a result.
But is that giving us an edge in the NFL player props betting market? Let’s take a look.
Editor’s note: Keep in mind that while this data is a helpful guide, it is not perfect nor complete — it’s one snapshot in time from one specific betting market, and results will vary across different books.
More Counterintuitive Results with One Big Difference
How do QBs perform relative to their Over/Under total on different prop bet types when their team is favored?
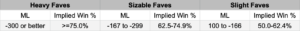
Because it doesn’t seem fair to put all favored teams in the same bucket, I separated them into three groups:
- Heavy Favorites (>=75.0% implied win probability or at least -300 on the Money Line)
- Sizable Favorites (62.5-74.9% implied win probability or between -167 and -299 on the Money Line)
- Slight Favorites (50.0-62.4% implied win probability or +100 to -166 on the Money Line)
You can also use this reference table below to see the definition of each group.
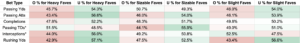
First, let’s see the data for QBs whose team was favored.
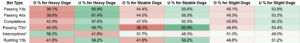
Next, QBs who were playing for the underdog.
How to Read the Table
Let’s use passing attempts as an example. You might think that a QB who’s playing for a heavy underdog would go over their attempts total more often because they would need to throw more passes to catch up, plus the perception of a garbage-time bump.
In fact, QBs go under 61.4% of the time when they are expected to lose big.
Takeaways
- QBs generally go under their passing yards, passing attempts, and completions more as underdogs. This is counterintuitive, but it aligns with what we now know about RBs and WRs.
- For the most part, we’ve gone with the theory that linemakers overcorrect for projected game script, but there could be another reason here. Since QB is the most important position, it’s possible teams are underdogs because their QB is bad. That would mean it’s possible QBs go under their props more as underdogs because they are the reason their team isn’t expected to win.
- Once again, it’s important to zoom out instead of honing in on one number. For example, QBs go under their passing attempts line 61.4% of the time as heavy underdogs but only 55.5% of the time as sizable dogs. That’s a massive difference considering those two buckets are right next to each other, and the real number for both groups probably lies somewhere in the middle.
- This doesn’t come as a surprise, but it’s almost always wise to bet the under – or is it? At least for passing yards, passing attempts, completions, and rushing yards, the under reigns supreme. Touchdowns and interceptions are more interesting, as we’ll talk about in the few bullet points.
- As heavy underdogs, QBs go over their interceptions line 58.2% of the time – a stark contrast from the trend we’ve seen with literally every other type of prop bet. Here’s the catch: Out of 1,442 total QB interceptions bets, the line was set at 0.5 on 1,398 of them. It was set at 1 on 31 of them. And 1.5 on 13. In other words, linemakers basically default to a line of 0.5 for interception props, and the juice is the only difference. Even though QBs who are heavy dogs go under their interceptions line just 41.8% of the time, you would still be profitable if you bet the under on every single one of them because the average odds are +145 (implied probability of 40.8%). Same thing for sizable underdogs who go under 48.3% of the time at +134 average odds (42.7% implied probability).
- It’s the same deal with touchdowns, although this one isn’t as cut-and-dried. QBs go under as heavy favorites 48.5% at +103 average odds – but you’re still negative because that’s an implied probability of 49.3%. It’s better to bet the under when a QB is playing for the underdog, but you’re still not getting much of an edge. They go under 53.4% at -111 average odds as slight underdogs, 63.9% at -120 as sizable dogs, and 59.7% at -129 as heavy dogs. On the whole, betting on QB TDs seems to be a dangerous endeavor.
- For the most part, we haven’t paid too much attention to average odds because they are all about the same for the other props, but it’s important here.
How to Play It
As usual, our default lean should be under, although it’s important to be aware of how average odds factors into the equation. It’s also critical to know that linemakers and the general betting public often overcorrect for projected game script.
Editor’s note: For my money, these are the most actionable findings from this series so far. Betting QB unders has been a staple for us, and we will be targeting these specific types of spots more going forward. Unlike the WR and RB position, which is driven by volume, quarterbacks need to be efficient. Bad ones playing on big underdogs are typically not.
Thanks for reading Part 3 of this four-part series. We’ll look at tight ends next time in the fourth and final article.